For CROs and Sales VPs
Your Best Rep Has a 52% Win Rate. Your Others Hit 19%. Here's Why.
The systematic approach that helped 100+ revenue teams identify their biggest conversion leaks and install repeatable frameworks that scale performance across entire organizations

Prefer to read? Download the playbook here
Your Best Rep Has a 52% Win Rate. Your Others Hit 19%. Here's Why.

How We Helped This Saas Mid-Market AE Earn Multiple 5-Figure Commission Checks
“The money is cool but I now have a repeatable system for success that I can apply to all opportunities. It's also helped me in health, relationships, and finances. “ – John Haboush
How We Helped Enterprise AE Become #1 at a $1.2B Organization and Pay Off His Parent's Mortgage
“Thank god I joined this sales program. It leveled up my sales skills, changed my mindset, and how I do things on a daily basis.“ – Julian Rojas
How We Helped This New AE Go From $130K/year to $281K/Year and #1/100
“I am blown away at my own success. It's been consistently DOUBLE every single month. I trust the process you teach and I'm not stressed anymore“ – Travis Wittman
How This EdTech Sales AE Closed $5M in a Tough Economy
“I've over-doubled my income in the first year. But what's better I'm now being seen as the EXPERT with all my prospects.“ – Joe Marino
Your sales team is hitting 47% of quota. Your best rep has a 52% win rate while the others average 19%. Same leads, same training, same territory quality.
That performance gap isn't talent. It's intelligence.
Right now, you're looking at $16.8M left on the table against your target. Your pipeline has millions sitting in various stages, but forecast accuracy hovers around 65%. Your reps average 127+ days to close deals that should close in 90.
You know something is systematically broken. Your gut tells you it's not just the reps.
Here's what most revenue leaders don't realize: The problem isn't that your team can't sell. The problem is that you don't know exactly where revenue is leaking and, more importantly, how much each specific leak is costing you.

Your top performer has cracked a code that others haven't. She's identified specific stakeholder patterns, developed better qualification questions, or mastered a demo framework that the rest of your team is missing. Or it’s something else completely.
Right now, you're treating symptoms:
Missing quota → More pipeline! More activity!
Conversion is low → More training!
Cycles are long → Better qualification! Let’s implement a sales methodology!
Deals are small → Target enterprise!
But what if the real issue is that your best performer has a discovery process that eliminates unqualified prospects in the first 10 minutes, while others spend weeks nurturing dead leads?
What if she's identified the three questions that reveal true buying intent, while others are still pitching features to people who will never buy?
Here's what we've learned from analyzing 100+ revenue teams: The companies consistently hitting quota aren't more talented. They've systematically identified what their top performers do differently and built frameworks that everyone else can execute.
The ones missing quota by millions? They're still hoping the bottom 80% will figure it out on their own.

❌ Your sales team is hitting 47% of quota.
❌ Your best rep has a 52% win rate while the others average 19%.
❌ Same leads, same training, same territory quality.
That performance gap isn't talent.
It's intelligence.
Right now, you're looking at $16.8M left on the table against your target. Your pipeline has millions sitting in various stages, but forecast accuracy hovers around 65%. Your reps average 127+ days to close deals that should close in 90.
You know something is systematically broken. Your gut tells you it's not just the reps.
Here's what most revenue leaders don't realize: The problem isn't that your team can't sell. The problem is that you don't know exactly where revenue is leaking and, more importantly, how much each specific leak is costing you.
Your top performer has cracked a code that others haven't. She's identified specific stakeholder patterns, developed better qualification questions, or mastered a demo framework that the rest of your team is missing. Or it’s something else completely.
Right now, you're treating symptoms:
Missing quota → More pipeline! More activity!
Conversion is low → More training!
Cycles are long → Better qualification! Let’s implement a sales methodology!
Deals are small → Target enterprise!
But what if the real issue is that your best performer has a discovery process that eliminates unqualified prospects in the first 10 minutes, while others spend weeks nurturing dead leads?
What if she's identified the three questions that reveal true buying intent, while others are still pitching features to people who will never buy?
Here's what we've learned from analyzing 100+ revenue teams: The companies consistently hitting quota aren't more talented. They've systematically identified what their top performers do differently and built frameworks that everyone else can execute.
The ones missing quota by millions? They're still hoping the bottom 80% will figure it out on their own.
Why Diagnosis Must Come Before Treatment
World-class heart surgeons don't operate without an MRI, blood work, and comprehensive diagnostics first. Because operating on assumptions doesn't just waste time and money - it can kill the patient.
Yet most sales leaders are performing major "surgery" on their revenue engines based on gut feelings and surface-level symptoms.

Consider the cost of misdiagnosis in revenue:
You implement MEDDIC across the entire team when only 30% of reps struggle with qualification
You hire three new reps to increase pipeline when the problem is conversion rates
You roll out Challenger methodology when the gap is in specific discovery conversation skills
You launch account-based marketing when your reps can't effectively engage economic buyers
The $800K Misdiagnosis
A fintech company was convinced their 34% quota attainment was a lead quality problem. They spent eight months and $280K rebuilding their lead generation engine.
The real issue? Their discovery calls averaged 22 minutes, while their top performer spent 47 minutes on discovery. The struggling reps were rushing to demos before understanding the business impact.
One methodology change would have fixed the problem in 30 days for the cost of a training session.
Why Diagnosis Must Come Before Treatment
World-class heart surgeons don't operate without an MRI, blood work, and comprehensive diagnostics first. Because operating on assumptions doesn't just waste time and money - it can kill the patient.
Yet most sales leaders are performing major "surgery" on their revenue engines based on gut feelings and surface-level symptoms.
Consider the cost of misdiagnosis in revenue:
You implement MEDDIC across the entire team when only 30% of reps struggle with qualification
You hire three new reps to increase pipeline when the problem is conversion rates
You roll out Challenger methodology when the gap is in specific discovery conversation skills
You launch account-based marketing when your reps can't effectively engage economic buyers
The $800K Misdiagnosis
A fintech company was convinced their 34% quota attainment was a lead quality problem. They spent eight months and $280K rebuilding their lead generation engine.
The real issue? Their discovery calls averaged 22 minutes, while their top performer spent 47 minutes on discovery. The struggling reps were rushing to demos before understanding the business impact.
One methodology change would have fixed the problem in 30 days for the cost of a training session.
The Solution: Revenue Engine OS Methodology
Case Study: The $4.2M Discovery

A Series C cybersecurity company was hitting 43% of their $28M target. The CEO was convinced they needed to double the sales team from 12 to 24 reps.
We discovered something different: Their top performer was converting qualified leads at 67% while the rest of the team averaged 23%. The difference wasn't talent or territory quality.
She had developed a specific discovery framework that identified economic buyers and quantified business impact within the first two calls. The other reps were still running generic discovery calls and hoping for the best.
The fix? We analyzed her discovery approach, identified the core principles that made it effective, and built a systematic framework that the entire team could execute consistently.
Result: $4.2M additional revenue with the same 12-person team.
A true Revenue Diagnostic doesn't just tell you that conversion rates are inconsistent. It tells you:
Exactly what your top performer does differently in discovery calls
Which specific behaviors create the 33-point conversion gap
How much revenue teaching those behaviors would unlock
What to implement first for maximum impact with minimum disruption
The difference between gut instinct and behavioral intelligence:
❌ Gut Instinct: "Sarah's just a natural, we need to hire more people like her"
✅ Behavioral Intelligence: "Sarah asks three specific qualification questions in the first 15 minutes that eliminate 47% of prospects before they enter our pipeline, allowing her to focus on deals that actually close. Teaching this framework to the team would improve overall conversion from 23% to 38% and add $2.8M in revenue."
See the difference? One accepts performance gaps as unchangeable and hopes for hiring “hero” reps. The other identifies teachable frameworks that can be systematically installed across the entire team.

The Solution: Revenue Engine OS Methodology
Case Study: The $4.2M Discovery
A Series C cybersecurity company was hitting 43% of their $28M target. The CEO was convinced they needed to double the sales team from 12 to 24 reps.
We discovered something different: Their top performer was converting qualified leads at 67% while the rest of the team averaged 23%. The difference wasn't talent or territory quality.
She had developed a specific discovery framework that identified economic buyers and quantified business impact within the first two calls. The other reps were still running generic discovery calls and hoping for the best.
The fix? We analyzed her discovery approach, identified the core principles that made it effective, and built a systematic framework that the entire team could execute consistently.
Result: $4.2M additional revenue with the same 12-person team.
A true Revenue Diagnostic doesn't just tell you that conversion rates are inconsistent. It tells you:
Exactly what your top performer does differently in discovery calls
Which specific behaviors create the 33-point conversion gap
How much revenue teaching those behaviors would unlock
What to implement first for maximum impact with minimum disruption
The difference between gut instinct and behavioral intelligence:
❌ Gut Instinct: "Sarah's just a natural, we need to hire more people like her"
✅ Behavioral Intelligence: "Sarah asks three specific qualification questions in the first 15 minutes that eliminate 47% of prospects before they enter our pipeline, allowing her to focus on deals that actually close. Teaching this framework to the team would improve overall conversion from 23% to 38% and add $2.8M in revenue."
See the difference? One accepts performance gaps as unchangeable and hopes for hiring “hero” reps. The other identifies teachable frameworks that can be systematically installed across the entire team.
The Revenue Engine OS Methodology
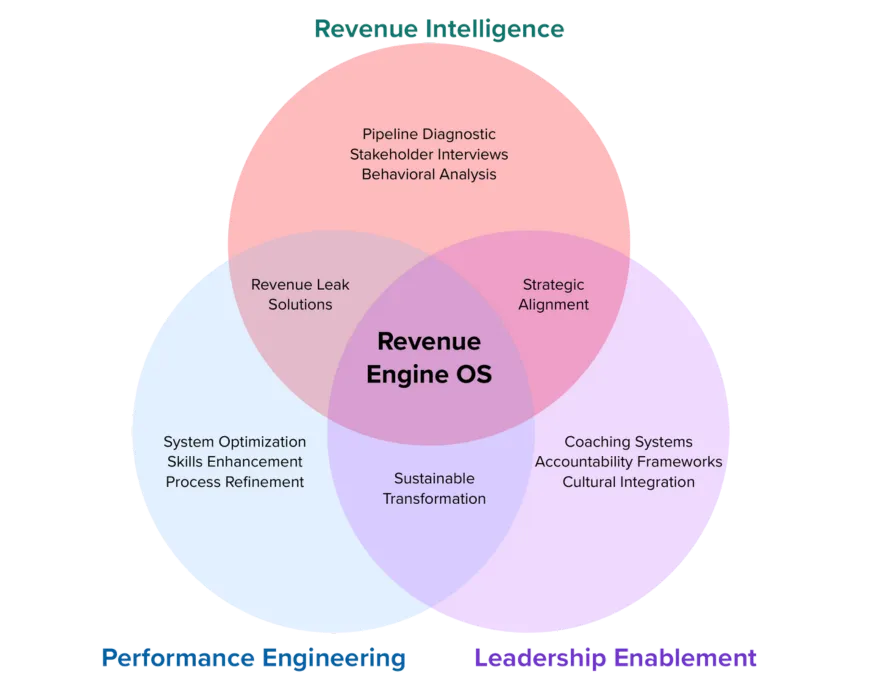
After analyzing 100+ revenue teams, we've developed a systematic approach that uncovers every meaningful leak in your sales engine. Our diagnostic process is powered by the Revenue Engine OS - our complete methodology that combines three interconnected elements.
Our diagnostic process represents the foundation of this system - identifying exactly where revenue dies and why. Here's the exact methodology that reveals precisely where your conversion leaks are costing you millions.
The Revenue Engine OS Methodology
After analyzing 100+ revenue teams, we've developed a systematic approach that uncovers every meaningful leak in your sales engine. Our diagnostic process is powered by the Revenue Engine OS - our complete methodology that combines three interconnected elements.
Our diagnostic process represents the foundation of this system - identifying exactly where revenue dies and why. Here's the exact methodology that reveals precisely where your conversion leaks are costing you millions.

Week 1: Performance Pattern Analysis
We extract 18-24 months of data and identify exactly where your biggest conversion leaks are occurring across the entire funnel.
Pipeline Forensics:
Stage-by-stage conversion patterns by rep, deal size, and lead source
Velocity analysis revealing hidden bottlenecks and process breakdowns
Win/loss patterns by competitor and sales stage with behavioral correlation
Activity pattern analysis - which specific behaviors actually drive results vs. busy work
The $2.3M Pipeline Revelation
An HR technology company had what looked like a healthy $38M pipeline spread across 47 opportunities. Standard pipeline reports showed everything was fine.
Our forensic analysis revealed that 71% of those opportunities had been in discovery for 60+ days. Industry benchmark is 30 days maximum. These weren't real opportunities - they were conversations that should have been disqualified weeks earlier.
When we helped them implement the qualification criteria their top performer used instinctively, pipeline dropped to $22M but close rate jumped from 23% to 41%.
Result: $2.3M more in actual revenue from fewer, better-qualified opportunities.
What Most Teams Miss:
Most revenue teams look at aggregate conversion rates and miss the critical patterns:
Rep Performance Variance: Why does Sarah convert at 48% while Mike struggles at 23%? Same territory, same leads, same training.
Deal Size Correlation: Do bigger deals really take longer, or is that an assumption hiding process inefficiencies?
Lead Source Reality: Which sources produce deals that actually close vs. deals that just clog your pipeline?
Time-in-Stage Patterns: What's the optimal vs. problematic duration for each stage, and which reps consistently exceed benchmarks?
Week 2: Behavioral Intelligence Gathering
We analyze actual sales conversations to identify specific conversion leaks and performance gaps.
Call Recording Deep Dive:
This is the most overlooked element of revenue diagnostics and the most revealing. We analyze actual sales conversations across three critical dimensions:
Discovery Conversation Analysis (6+ recordings):
Stakeholder mapping effectiveness and economic buyer identification
Pain point discovery depth and business impact quantification
Objection handling patterns and competitive differentiation
Next step clarity and advancement techniques
Demo/Presentation Analysis (6+ Recordings):
Customization level based on discovered needs vs. generic feature dumps
Technical question handling and value articulation methods
Business outcome connection and ROI presentation effectiveness
Deal advancement and commitment-securing approaches
Proposal/Negotiation Analysis (6+ recordings):
Pricing presentation confidence and objection anticipation
Value-based vs. discount-driven negotiation patterns
Decision process navigation and closing techniques
The Demo Transformation
A sales operations platform was frustrated with their 19% demo-to-close conversion rate. Management assumed it was a product-market fit issue.
Our conversation analysis revealed something different: Average reps spent 43 minutes showing features and 17 minutes on discovery and next steps. Their top performer flipped this ratio completely.
He spent 31 minutes on discovery recap and custom business scenarios, only 29 minutes on actual features. His demo conversion rate: 54%.
We restructured their entire demo methodology around his approach. Team-wide conversion jumped to 41% within 60 days.
What This Analysis Reveals:
Most teams assume they know why deals die. The conversation analysis reveals the truth:
Structural Issues: Do reps follow consistent methodology or wing it call by call?
Skill Gaps: Which specific techniques do top performers use that others completely miss?
Process Breakdowns: Are reps properly qualifying before advancing opportunities, or advancing hope?
Week 3: Management System Assessment
Revenue problems often stem from management practices that either amplify or suppress top performer behaviors.
Leadership Effectiveness Analysis:
We assess three critical management dimensions:
Pipeline Review Quality (3+ recordings):
Skills-based coaching vs. status update meetings
Deal quality inspection depth and methodology reinforcement
Forecast accuracy improvement and pipeline risk identification
Performance gap identification and systematic improvement planning
1:1 Coaching Effectiveness (3+ recordings):
Specific skill development vs. general motivation talks
Call review frequency and feedback quality
Process adherence accountability and improvement tracking
Individual development planning and career progression support
Team Development Systems:
Best practice identification and scaling methodologies
Performance variance analysis and intervention strategies
Onboarding effectiveness and ramp time optimization
Culture building around systematic improvement vs. heroic performance
The Management Multiplier Effect
A $85M revenue operations company had two sales managers running identical territories with similar rep experience levels. One manager's team consistently hit 110%+ of quota. The other's team averaged 43%.
The high-performing manager held weekly deal reviews focused on methodology execution, not just pipeline status. He would listen to his reps' discovery calls and coach specific questioning techniques.
The struggling manager held "status update" meetings and hoped motivation would solve performance gaps.
When we trained the second manager on skills-based coaching methodology, his team performance jumped to 104% average within 90 days.
Week 4: Systematic Framework Development
We synthesize all findings into specific frameworks and systems that can be installed across the team.
Revenue Leak Identification:
Using comprehensive data analysis, conversation intelligence, and management assessment, we identify exactly where revenue dies.
Stage-Specific Conversion Leaks:
Discovery qualification gaps reducing pipeline quality
Demo/presentation gaps lowering advancement rates
Proposal presentation gaps extending sales cycles
Negotiation skill gaps reducing deal size and win rates
Rep Behavior Pattern Analysis:
Specific skill gaps affecting multiple team members
Process adherence inconsistencies creating performance variance
Activity quality variations (busy work vs. revenue-generating activities)
Pipeline management effectiveness differences
Management System Gaps:
Coaching quality inconsistencies between managers
Forecast accuracy improvement opportunities
Process enforcement and accountability gaps
Performance development and improvement system weaknesses
Impact Quantification Framework:
For each identified conversion leak, we calculate precise revenue impact:
Discovery Quality Impact: If we improve discovery effectiveness to move qualified opportunity rate from 65% to 78%, affecting 200 opportunities per quarter, averaging $75K, that's $1.95M in additional qualified pipeline per quarter.
Conversion Rate Impact: If we increase demo-to-proposal rate from 34% to 42% (matching top performer levels), affecting 156 demos currently in your pipeline, that's an additional 12.5 proposals. Assuming a 35% proposal-to-close rate, this generates $329K in revenue from current opportunities alone.
Sales Cycle Impact: If we reduce average sales cycle from 127 days to 105 days through systematic process improvements, we increase rep productivity by 17%, translating to $2.8M additional annual revenue with current team size.
The $8.7M Enterprise Transformation
A $180M ARR identity management company had identical sales processes across five regional teams, but annual performance varied by $23M between top and bottom regions.
Our diagnostic identified three specific management practices and two systematic frameworks that separated the top-performing region:
Weekly skills-based pipeline reviews instead of status meetings
Systematic objection handling practice using real scenarios from lost deals
Specific economic buyer engagement framework with documented conversation starters
Documented competitive positioning for their top three rivals with win/loss analysis
Consistent proposal follow-up sequences with value reinforcement
When we installed these systematic frameworks across all regions, the company added $8.7M in annual revenue without changing headcount, territories, or compensation plans.
The Hidden Complexity (And Why Most Teams Need Expert Help)
You could attempt this analysis internally. But here's what 100+ diagnostics have taught us:
The Scale Experience Gap: Most sales leaders have never operated revenue engines at true scale.
Building and leading teams of 110+ reps generating $200M+ in revenue annually requires a different understanding of conversion patterns, process design, and systematic performance management than most leaders have experienced.
The Conversion Leak Analysis Challenge: Identifying where revenue actually leaks requires specialized expertise in funnel analysis and conversion psychology.
Most teams can spot obvious problems but miss the subtle systematic breakdowns that create real impact.
The Data Interpretation Problem: CRM data shows what happened, but understanding why requires correlation analysis across dozens of variables and performance indicators.
Most internal teams either oversimplify the analysis or get overwhelmed by complexity.
The Objectivity Issue: Internal teams see what they expect to see.
External analysis reveals patterns that are invisible when you're inside the system, especially conversion leaks that have become "normal" over time.
The Framework Installation Expertise Gap: Identifying conversion leaks is only 30% of the challenge.
Building those insights into repeatable frameworks and installing them systematically across large teams requires specialized experience that most leaders lack.
The Framework Installation Reality: This diagnostic requires 60-80 hours of focused analysis time, plus expertise in large-scale revenue operations, statistical analysis, and systematic framework design.
The Hidden Complexity
(And Why Most Teams Need Expert Help)
You could attempt this analysis internally. But here's what 100+ diagnostics have taught us:
The Scale Experience Gap: Most sales leaders have never operated revenue engines at true scale.
Building and leading teams of 110+ reps generating $200M+ in revenue annually requires a different understanding of conversion patterns, process design, and systematic performance management than most leaders have experienced.
The Conversion Leak Analysis Challenge: Identifying where revenue actually leaks requires specialized expertise in funnel analysis and conversion psychology.
Most teams can spot obvious problems but miss the subtle systematic breakdowns that create real impact.
The Data Interpretation Problem: CRM data shows what happened, but understanding why requires correlation analysis across dozens of variables and performance indicators.
Most internal teams either oversimplify the analysis or get overwhelmed by complexity.
The Objectivity Issue: Internal teams see what they expect to see.
External analysis reveals patterns that are invisible when you're inside the system, especially conversion leaks that have become "normal" over time.
The Framework Installation Expertise Gap: Identifying conversion leaks is only 30% of the challenge.
Building those insights into repeatable frameworks and installing them systematically across large teams requires specialized experience that most leaders lack.
The Framework Installation Reality: This diagnostic requires 60-80 hours of focused analysis time, plus expertise in large-scale revenue operations, statistical analysis, and systematic framework design.
Choose Your Path to Revenue Recovery

Path 1: The DIY Revenue Audit (At Your Own Risk)
Attempt this analysis internally using your existing team. Here's what that actually costs:
Time Investment: 60-80 hours of senior management time over 4-6 weeks
Sales VP time: $175K+ annual salary = $84/hour = $6,720 minimum
RevOps Manager time: $128K+ annual salary = $62/hour = $4,960 minimum
Data Analyst time: $91K+ annual salary = $44/hour = $3,520 minimum
Total labor cost: $15,200+ (and that assumes they know what they're doing)
Opportunity Cost: While your team spends 6 weeks analyzing data, they're not:
Coaching reps through stuck deals ($500K+ in pipeline at risk)
Implementing quick wins that could improve conversion immediately
Managing current quarter performance (missing quota while studying why you miss quota)
The Risk: Without experience analyzing revenue engines at scale, you'll likely:
Miss the subtle conversion leaks that create the biggest impact
Implement generic solutions that don't address your specific problems
Waste 6 weeks to conclude things you already suspected
Create more analysis paralysis instead of systematic improvements
Most Likely Outcome: You'll spend $15K+ in internal resources and $500K+ in opportunity costs to discover "demo conversion is low and sales cycles are long" - insights that don't change anything.

Path 2: Expert-Led Revenue Diagnostic
We complete the entire analysis in 2-3 weeks and deliver your Revenue Acceleration Brief:
Stage-by-Stage Funnel Analysis:
Stage-by-stage funnel breakdowns and conversion leak identification
Rep and manager interviews to uncover execution gaps
Missed revenue opportunities identified by deal stage
1-page Revenue Acceleration Brief with estimated impact and priority roadmap
Clear recommendations for systematic performance improvements
The Guarantee: Walk away with a clear plan to fix your biggest revenue constraints, whether or not we work together on implementation.

Choose Your Path to Revenue Recovery
Path 1: The DIY Revenue Audit (At Your Own Risk)
Attempt this analysis internally using your existing team. Here's what that actually costs:
Time Investment: 60-80 hours of senior management time over 4-6 weeks
Sales VP time: $175K+ annual salary = $84/hour = $6,720 minimum
RevOps Manager time: $128K+ annual salary = $62/hour = $4,960 minimum
Data Analyst time: $91K+ annual salary = $44/hour = $3,520 minimum
Total labor cost: $15,200+ (and that assumes they know what they're doing)
Opportunity Cost: While your team spends 6 weeks analyzing data, they're not:
Coaching reps through stuck deals ($500K+ in pipeline at risk)
Implementing quick wins that could improve conversion immediately
Managing current quarter performance (missing quota while studying why you miss quota)
The Risk: Without experience analyzing revenue engines at scale, you'll likely:
Miss the subtle conversion leaks that create the biggest impact
Implement generic solutions that don't address your specific problems
Waste 6 weeks to conclude things you already suspected
Create more analysis paralysis instead of systematic improvements
Most Likely Outcome: You'll spend $15K+ in internal resources and $500K+ in opportunity costs to discover "demo conversion is low and sales cycles are long" - insights that don't change anything.
Path 2: Expert-Led Revenue Diagnostic
We complete the entire analysis in 2-3 weeks and deliver your Revenue Acceleration Brief:
Stage-by-Stage Funnel Analysis:
Stage-by-stage funnel breakdowns and conversion leak identification
Rep and manager interviews to uncover execution gaps
Missed revenue opportunities identified by deal stage
1-page Revenue Acceleration Brief with estimated impact and priority roadmap
Clear recommendations for systematic performance improvements
The Guarantee: Walk away with a clear plan to fix your biggest revenue constraints, whether or not we work together on implementation.
What Happens When You Systematically Install Performance Frameworks
Companies that complete proper Revenue Engine OS implementations typically see:
Pipeline Quality Transformation: Better qualification means deals that actually close instead of hopeful conversations
Conversion Rate Acceleration: Specific skill transfers directly impact stage-to-stage progression
Sales Cycle Compression: Process improvements eliminate friction and unnecessary delays
Deal Size Growth: Better discovery and positioning uncover larger opportunities
Forecast Accuracy Improvement: Managers can predict outcomes based on methodology execution
The Compound Effect: A 10% improvement in conversion doesn't just affect this quarter. It affects every quarter going forward, because you've permanently installed better frameworks into your revenue engine.
Looking at typical revenue improvements from systematic conversion leak fixes:
15% conversion improvement from discovery framework installation
22% sales cycle reduction from qualification and handoff system improvements
18% average deal size increase from economic buyer engagement frameworks
Combined impact: 35-45% improvement in overall sales effectiveness

The Marketing Attribution Platform's Transformation
A marketing attribution platform completed a Revenue Engine Diagnostic™ that identified weak champion development as their biggest leak. Reps were selling to users instead of building economic buyers as champions.
After installing a systematic champion development framework, their average deal size increased from $67K to $94K and win rate jumped from 31% to 47%.
Total impact: $5.2M additional annual revenue with the same team and lead volume.
What Happens When You Systematically Install Performance Frameworks
Companies that complete proper Revenue Engine OS implementations typically see:
Pipeline Quality Transformation: Better qualification means deals that actually close instead of hopeful conversations
Conversion Rate Acceleration: Specific skill transfers directly impact stage-to-stage progression
Sales Cycle Compression: Process improvements eliminate friction and unnecessary delays
Deal Size Growth: Better discovery and positioning uncover larger opportunities
Forecast Accuracy Improvement: Managers can predict outcomes based on methodology execution
The Compound Effect: A 10% improvement in conversion doesn't just affect this quarter. It affects every quarter going forward, because you've permanently installed better frameworks into your revenue engine.
Looking at typical revenue improvements from systematic conversion leak fixes:
15% conversion improvement from discovery framework installation
22% sales cycle reduction from qualification and handoff system improvements
18% average deal size increase from economic buyer engagement frameworks
Combined impact: 35-45% improvement in overall sales effectiveness
The Marketing Attribution Platform's Transformation
A marketing attribution platform completed a Revenue Engine Diagnostic™ that identified weak champion development as their biggest leak. Reps were selling to users instead of building economic buyers as champions.
After installing a systematic champion development framework, their average deal size increased from $67K to $94K and win rate jumped from 31% to 47%.
Total impact: $5.2M additional annual revenue with the same team and lead volume.
The Bottom Line Reality
Your team isn't broken. Your reps don't lack potential. You don't need to hire your way to better performance.
You need to systematically identify your biggest conversion leaks and install frameworks that address them.

The Board Meeting Game-Changer
An API management company's CRO was facing intense pressure about missing quota by $8.7M. Instead of making excuses or promising to hire more reps, he presented results from their Revenue Engine Diagnostic™.
Three specific conversion leaks identified. $6.2M quantified revenue impact. 90-day implementation plan with measurable milestones.
The board approved investment in systematic performance improvement instead of expensive new hiring. Six months later: 108% of quota achieved.
"That diagnostic didn't just save my job. It transformed how we think about sales performance."
The Bottom Line Reality
Your team isn't broken. Your reps don't lack potential. You don't need to hire your way to better performance.
You need to systematically identify your biggest conversion leaks and install frameworks that address them.
The Board Meeting Game-Changer
An API management company's CRO was facing intense pressure about missing quota by $8.7M. Instead of making excuses or promising to hire more reps, he presented results from their Revenue Engine Diagnostic™.
Three specific conversion leaks identified. $6.2M quantified revenue impact. 90-day implementation plan with measurable milestones.
The board approved investment in systematic performance improvement instead of expensive new hiring. Six months later: 108% of quota achieved.
"That diagnostic didn't just save my job. It transformed how we think about sales performance."
Ready to Stop Hoping and Start Scaling?
The diagnostic investment recovers its cost when we help you improve just one additional deal per rep per quarter. The ongoing impact typically delivers 400-1000% ROI within 12 months.
Your biggest revenue opportunities aren't hiding in new strategies. They're hiding in the conversion leaks you haven't systematically identified and fixed.
Revenue Diagnostic Investment: Starting at $25,000
Complete analysis delivered in 2-3 weeks, including:
Stage-by-stage funnel breakdowns and conversion leak identification
Rep and manager interviews to uncover execution gaps
Missed revenue opportunities identified by deal stage
1-page Revenue Acceleration Brief with estimated impact and priority roadmap
Clear recommendations for systematic performance improvements
Ready to identify your conversion leaks and install frameworks that fix them?
Let's schedule a 30-minute conversation to discuss your specific performance patterns and determine if a systematic diagnostic makes sense for your team.
Not Ready to Talk Yet?
If you want to explore the complete methodology first, download our Revenue Diagnostic Playbook - a comprehensive 27-page guide that includes:
Complete 4-week diagnostic framework with step-by-step instructions
Implementation templates and worksheets for data analysis and ROI calculation
Interview scripts for reps and managers
3+ detailed case studies with specific frameworks and results
Quick-start checklist for immediate impact opportunities
Red flag indicators and success metrics tracking
This is the same methodology we use with clients who pay $25,000+ for our diagnostic service.
Because your biggest revenue opportunities aren't hiding in new strategies. They're hiding in the conversion leaks you haven't systematically identified and fixed.
We've helped 100+ revenue teams systematically improve performance by implementing the Revenue Engine OS methodology. The approach works across SaaS, fintech, cybersecurity, and B2B technology sectors.
If you're ready to stop accepting performance variance as inevitable and start systematically installing what works, let's talk.

Venli Consulting Group | © 2026 All Rights Reserved
Privacy Policy Terms and Conditions
This site is not a part of the Facebook™ website or Facebook™ Inc. Additionally, this site is NOT endorsed by Facebook™ in any way. FACEBOOK™ is a trademark of FACEBOOK™, Inc.
DISCLAIMER: The sales figures stated on this page and discussed in the training curriculum are our personal sales figures and in some cases the sales figures of previous or existing clients. Please understand these results are not typical. We’re not implying you’ll duplicate them (or do anything for that matter). The average person who buys “how to” information gets little to no results. We’re using these references for example purposes only. Your results will vary and depend on many factors including but not limited to your background, experience, and work ethic.
All business entails risk as well as massive and consistent effort and action.