


Founder-Led Sales: 15 Lessons From $1B in B2B Sales - Copy
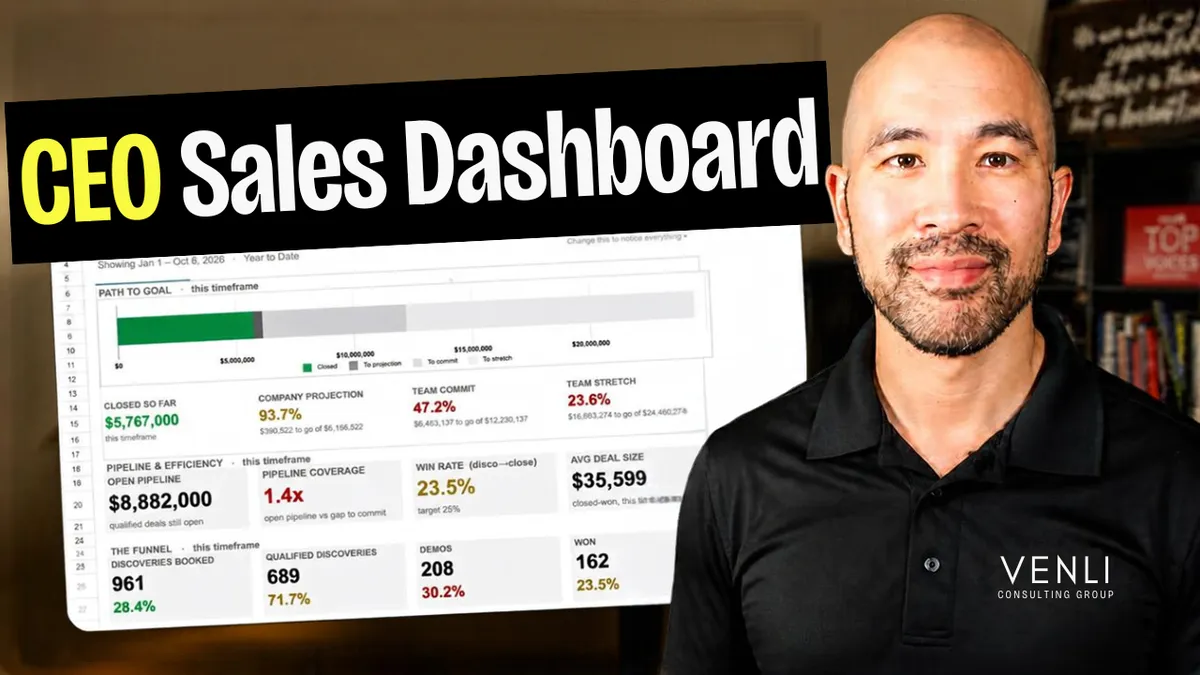
Executive Summary: A CEO sales dashboard is a one-page scoreboard that shows a founder every deal, every rep, and whether the team will hit the number, without texting anyone. The free CEO Sales Dashboard runs in Google Sheets. It takes five minutes to set up and 60 seconds to read every Monday. It also gives you your founder independence score: your team's win rate without you, divided by your win rate with you. Aim for 80% or higher.
Get the free CEO Sales Dashboard
Why do founders stay stuck in their own sales deals?
Ask a founder why they're still on every big call and you'll hear one of two answers.
The first: "If I'm not on the call, I have no idea what's going on." That's a visibility problem.
The second: "If I'm not on the call, we lose the deal." That's a closing problem. The team can't win it without the founder yet.
Most founders have both. The order matters. You can't fix closing until you fix visibility, because you can't see which deals your team is losing, or why. A sales dashboard fixes the first problem and puts a number on the second.
What is a CEO sales dashboard?
A CEO sales dashboard is a single view of your sales team that a founder can read in about a minute. It shows closed revenue against target, open pipeline, conversion rates at each stage of the funnel, how each rep is performing, and how much of the revenue still depends on the founder. Reps update it. The founder reads it.
A good one answers four questions every Monday:
#1 Will we hit the number?
#2 Where are deals dying?
#3 Which rep needs me this week?
#4 How much of our revenue still runs through me?
Why your CRM can't tell you if you'll hit the quarter
Most founders run what I call the Friday Chase. You text four reps, "Where are we on this one?" You get four versions of "looking good," and you walk into the weekend with no idea if you'll hit the quarter.
The CRM should solve this. In practice, a CRM is a filing cabinet. You can find anything in it if you go looking. At 7 a.m. on a Monday, nobody has time to go looking. And the reports someone built three years ago rarely get trusted.
So founders fall back on the only report they trust: themselves, on the call. When you are the dashboard, you can't leave the building.
The 3 principles behind a sales dashboard that gets used
Principle 1: Whoever owns the number types the number. Each rep enters their own activity and deals. The rep who types "three demos" knows he had three demos. Don't automate it, and don't fill it in yourself. Typing is how reps learn their numbers, and it's the first piece of the business you hand off.
Principle 2: Track the steps that make the money. Revenue tells you what already happened. Conversations, discoveries, demos and wins move first. When discovery-to-demo drops in week three, you can fix it in week three.
Principle 3: Score the founder too. Every deal gets one yes or no: was the founder on the call? That gives you your win rate with you and without you. The gap between them is the clearest measure of founder dependence you'll find.
How to set up the CEO Sales Dashboard in Google Sheets
Setup takes about five minutes. One rule runs the whole sheet: yellow cells are the only cells anyone types in. Everything else calculates on its own and is locked, so nobody breaks a formula.
Step 1: Add your reps and quarterly projections. On the Setup tab, type in each rep's name and the company projection for each quarter.
Step 2: Set each rep's commit and stretch goal. Open each rep's tab and enter two numbers. Let the rep pick the commit. A rep who hits a goal they chose believes they can hit the next one.
Step 3: Log daily activity. Each rep spends about 30 seconds a day on their own tab: cold emails, cold calls, connects with a decision maker, discoveries booked, qualified discoveries, demos booked and demos done.
Step 4: Log every real deal. Each deal gets one row in the Opportunity Log: rep, account, amount, stage, close date, next step, decision date, last touched, and Founder on Call (yes or no).
How to read a sales dashboard in 60 seconds
Open the Dashboard tab, pick a timeframe, and work through the four questions. Here's what that looks like with the template's example data.
Will we hit the number? Closed revenue is $5,767,000, or 94.5% of the company projection. That looks great until you check pipeline coverage: 1.4x. Pipeline coverage is the dollars of open, qualified deals for every dollar you still need to close. You want about 3x. At 1.4x, the team runs out of deals before it runs out of quarter.
Where are deals dying? The funnel shows 948 discoveries booked, 682 qualified, 206 demos and 162 wins. Only 30 of every 100 qualified discoveries reach a demo, against a target of 60. The leak sits between the first real conversation and the demo, so that's what you coach this week.
Which rep needs you? Stack rankings sort every rep by closed revenue, attainment against their own target, and accounts won. A rep at the bottom of all three gets your 1:1 this week.
What is a founder independence score?
Your founder independence score is your team's win rate on deals you weren't on, divided by your win rate on deals you were on.
In the example data, the founder wins 94 of every 100 deals he joins. The team wins 59 without him. 59 divided by 94 is about 63%. The target is 80% or higher. At 63%, the team wins about six deals for every ten the founder would win.
The sheet only shows the split once there are at least five closed deals with the founder and five without, because small samples mislead.
3 mistakes that make a sales dashboard useless
Mistake 1: The founder fills it in. It's faster, and it puts you right back at the center. Reps type. You read.
Mistake 2: Reading it and changing nothing. A smoke alarm tells you there's a fire. Somebody still has to grab the hose. Use one rule: any red or yellow number needs a one-line plan from the rep before their 1:1. Run that inside a weekly rhythm of 1:1s and deal reviews.
Mistake 3: Treating the dashboard as the whole system. The dashboard solves visibility and measures the closing gap. Closing the gap takes two more things. The first is a written standard for what a great rep sounds like on a call, with every rep certified against it. We call that Founder Grade™. The second is a weekly operating rhythm, run by a manager, that acts on what the dashboard shows. We call that Revenue Rhythm™. When you add a seat, Hire Ready™ means building the system first and hiring into it.
Your next step: find your founder independence score
This week, add every deal your team closed last quarter to the Opportunity Log and mark Founder on Call for each one. Then check your founder independence score on the Dashboard. If it's below 80%, that gap is what keeps you in the deals. It's also your starting line.
Get the free CEO Sales Dashboard
If that number worries you, or you'd like help building a sales team that closes without you, book a free Revenue Strategy Call. There's nothing to prepare.
Frequently asked questions
Do I need a CRM to use the CEO Sales Dashboard?
No. It runs in Google Sheets. If you already have a CRM, keep it. The dashboard gives you the one-minute view your CRM doesn't.
How long does it take reps to fill in?
About 30 seconds a day for activity, plus one row per real deal in the Opportunity Log.
How many reps does the template handle?
Up to 20. It's built for founder-led teams with 2 to 20 reps.
What is a good pipeline coverage ratio?
About 3x. That means $3 of open, qualified pipeline for every $1 left to close this period.
What is a good founder independence score?
80% or higher. Below that, your team wins noticeably fewer deals when you're off the call.
Is the CEO Sales Dashboard free?
Yes. The Google Sheet and the walkthrough video are free at https://venliconsulting.com/dash.